Our spring weather is here and the watershed is getting green! Thankfully the lake is not green since this is the time of year when water clarity really increases. You will be able to see that in the Secchi data below.
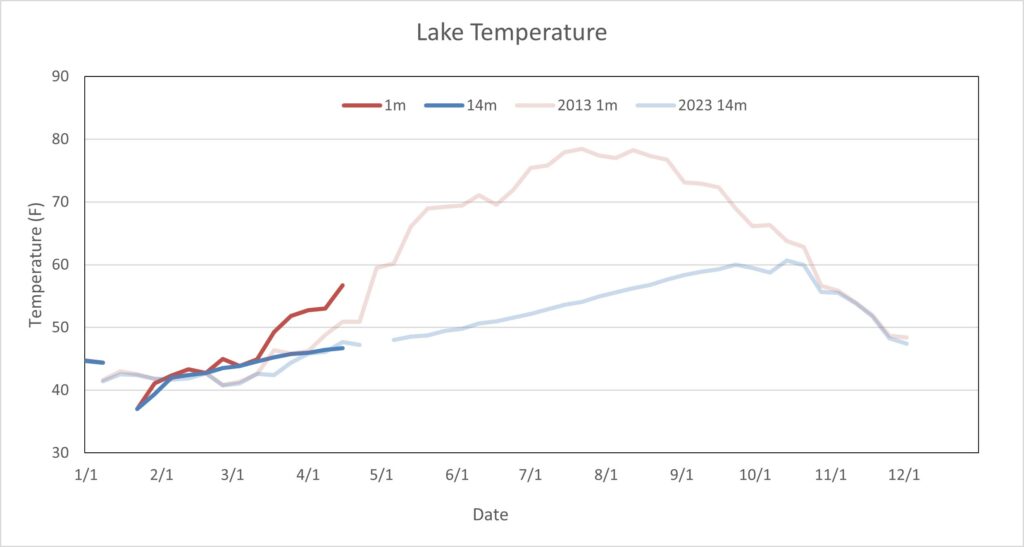
Lake Temperature
The water temperature has increased a lot this past month, and is much warmer than it was last year at this time. In 2023 the water temperature was 51 degrees this time of year, but it has reached 57 degrees this year. The warmer water and sunny conditions may affect our lake ecology by shifting our diatom bloom and clear water phase earlier this spring.
Secchi
This is the time of year with the best water clarity, and it has been increasing over the past month. We are seeing 17 feet down into the water column as of April 15 so we will see if we exceed the 19 feet we saw last year.

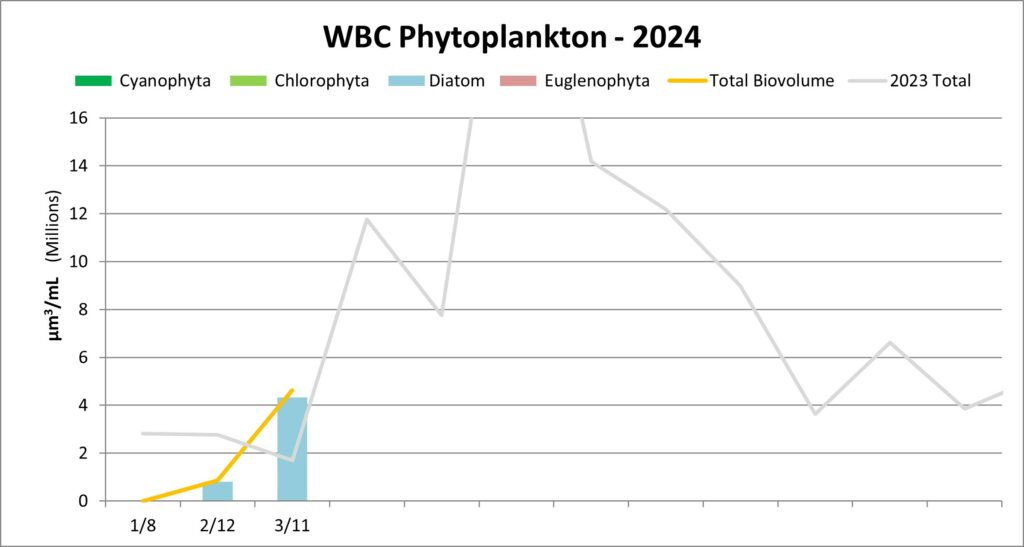
Phytoplankton
Phytoplankton biovolume is shown for the three main basins all on the same scale so you can see how one compares to the other. We only have a few data points to draw from, but West Bay and Lakewood Bay seem to be less active than Main Lake. Lakewood Bay has very low algae biomass so far this spring, with it barely showing on the graph.

Diatoms were very active in February and March, but by the end of March the population had declined dramatically. This is typical this time of year when zooplankton become active and consume most algae in the lake. This is the start of our “clear water phase” and the reason for the high Secchi readings you saw in the second graph.

West Bay is always full of diatoms year around. While this impedes water clarity it also limits plant and cyanobacteria growth. If this shallow bay were maintained for clear water we would be constantly treating aquatic plants and may have to contend with cyanobacteria. The bay does occasionally see cyanobacteria, but that is primarily due to it blowing in from the Main Lake.